Monday, March 3, 2014
Happy World Wildlife Day
3 March 2014 is the very first World Wildlife Day. The UN General Assembly declared March 3 to be World Wildlife Day. This declaration was made on 20 December 2013. The purpose is about awareness about the wildlife, about the flora and fauna on this planet. This blog entry has a playlist of wildlife footage, mostly birds. Click here to view the playlist.
Thursday, February 27, 2014
Thursday, February 20, 2014
US Map of Gross Domestic Product
Recently, a map was found on the internet, and Business Insider got a hold of it. It is a map showing where the USA GDP comes from.

What the map reveals is where half of the GDP comes from. And according to the map, half of it comes from the top 23 metropolitan areas of the USA.
What this map does not show, however, is by what industries the GDP in the USA comes from. According to the information provided, the NYC-Newark-Jersey City metro has the highest GDP, $1.3 trillion. It makes sense as this is the largest metropolitan area in the nation. New York City is the major financial center of the USA. This metro area also has a major port industry, as alot of maritime trade takes place here. This is also a very expensive place to rent or buy a home. And manufacturing contributes a significant amount to the economy in this area. High technology is a growing industry in the NYC metropolitan area. The top 5 industries by GDP in the USA are: Real Estate/renting/leasing, government, finance/insurance, healthcare, and durable manufacturing.
Lets look at other metros, like Los Angeles, Chicago, and Houston. All of these cities are major trading centers, as all of them are on water. Houston is home to ConocoPhillips, the 4th largest corporation in the USA by revenue, as well as the 3rd largest energy company in the USA. Houston is a major oil-producing region, home to the Energy Corridor. Chicago is a major transportation and distribution center because of its geography. Insurance plays an important part of Chicago's economy. Chicago is also a major financial center in the USA. It is home to the Chicago Stock Exchange. Although not as significant as it once was, manufacturing still plays a part in Chicago's economy. Los Angeles is known for its entertainment industry. However lets not focus only there. 6 Fortune 500 companies make their home in Los Angeles. Occidental Petroleum, Health Net, Reliance Steel and Aluminium, AECOM(engineering firm), CBRE Group(real estate firm), and Tutor Perini Corporation(building contractor company). All represent major parts of the economy, such as the energy sector, manufacturing, health, and real estate. Los Angeles metropolitan area is the largest manufacturing center in the western USA.
The map shows which places contribute to 50% of the USA's GDP. It does not say which industries are part of it or which industries those particular cities have. In order to understand geography, one has to look at the map, and then look beyond it.
Thursday, February 13, 2014
Wednesday, February 12, 2014
Landsat 8, one year later.

The Landsat program has been taking place for almost 42 years. This is the most continuous project of collecting satellite imagery. Last year, 11 February 2013, the Landsat 8 was launched on the Atlas V spacecraft.
To sum this up, this particular satellite has 11 spectral bands, and 2 of those bands will be collecting data related to water quality and the high cirrus clouds. 7 spectral bands will be compatible with sensors found on older Landsat satellites.
For more information, click on this link: https://www.youtube.com/watch?v=mXMld8nKPiU
Sunday, February 9, 2014
Thursday, February 6, 2014
GDP by state: Comparing US states to nations.
This morning, I found a map by PolicyMic. Here is the link to it: http://www.policymic.com/articles/81177/here-s-how-rich-every-u-s-state-really-is-in-one-eye-opening-map
Basically, it is taking the Gross Domestic Product of the states in the USA, and comparing it to certain nations.

This map leaves alot to wonder. PanGeographic will have a different take on this. In the article by PolicyMic, it mentioned than none of these estimated were adjusted for population. There was a comparison made between Minnesota and Nigeria. It was also mentioned that Minnesota has a population of 5.5 million while Nigeria has a population of 175 million.
PanGeographic will go a bit further. Minnesota, with a population of 5.5 million people, has the same GDP as Nigeria, a nation of 175 million people. North Dakota, next door, has a population close to 700,000 residents, and a GDP the equivalent of Kenya, a nation of 43 million people. GDP is the money value of goods and services being put into the economy. Nigeria and Kenya has large numbers of its population not living in the cash economy. Nigeria has plenty of oil. There are also many people who live a subsistence lifestyle, meaning they grow enough for their own consumption. And there are many who struggle to feed themselves.
In short, if Minnesota and North Dakota has as many people as Nigeria and Kenya,chances are, the GDP of those places would be much higher.
In short, it is better to look at the per capita side of this.
Basically, it is taking the Gross Domestic Product of the states in the USA, and comparing it to certain nations.
This map leaves alot to wonder. PanGeographic will have a different take on this. In the article by PolicyMic, it mentioned than none of these estimated were adjusted for population. There was a comparison made between Minnesota and Nigeria. It was also mentioned that Minnesota has a population of 5.5 million while Nigeria has a population of 175 million.
PanGeographic will go a bit further. Minnesota, with a population of 5.5 million people, has the same GDP as Nigeria, a nation of 175 million people. North Dakota, next door, has a population close to 700,000 residents, and a GDP the equivalent of Kenya, a nation of 43 million people. GDP is the money value of goods and services being put into the economy. Nigeria and Kenya has large numbers of its population not living in the cash economy. Nigeria has plenty of oil. There are also many people who live a subsistence lifestyle, meaning they grow enough for their own consumption. And there are many who struggle to feed themselves.
In short, if Minnesota and North Dakota has as many people as Nigeria and Kenya,chances are, the GDP of those places would be much higher.
In short, it is better to look at the per capita side of this.
Tuesday, February 4, 2014
2014 Winter Olympics. Parallels between Sochi and Vancouver.


.jpg)
The 2014 Winter Olympics and set to begin on Thursday, 6 February. As is known, they will be held in the Russian city of Sochi.
One thing to consider is the fact that these will be the first Winter Olympics to be held in a subtropical climate, at least the indoor events. Some people look at this is very unusual. Although Russia is known for very cold winters, Sochi has a climate similar to southern Japan or the southeastern USA. The average daytime temperature in January is 50 F(10 C) and at night it is 35 F (2 C).
Well, this is to be considered. Vancouver, Canada held the 2010 Winter Olympics. Although Vancouver does not have a subtropical climate, it does have very mild winters in comparison to the rest of Canada. The average January daytime temperature in Vancouver is 45 degrees F(7 degrees C), The average night time temperature is 33 F (1 C). Quite mild for a city at a latitude of 49 N. Canada is known for very cold winters, so Vancouver stands out.
Here are the parallels:
-Vancouver has relatively mild winters. Sochi also has mild winters. Both cities are among the warmest cities in their respective nations. Both nations are known for cold, snowy winters.
-Vancouver and Sochi are located near high mountains. Vancouver held snow-related events in the mountains(especially in Whistler), Sochi will hold snow-related events in the mountains, at Krasnaya Polyana.
-Both cities are coastal cities


If Vancouver could do it, then Sochi could pull this off too. One way to look at this is from a perspective of geography. While indoor events will be held in Sochi proper, the skiing, luge, and bobsleighing events will be held in Krasnaya Polyana, a town in the mountains, where it will be colder and there would likely be more snow.
Tuesday, January 28, 2014
Myrtle Beach, South Carolina tourism commercial: Looks good, but incorrect in meteorological terms.
Before watching a youtube video, a Myrtle Beach Chamber of Commerce commercial played, geared for Valentines Day. There were scenes of beaches, and people walking and frolicking on the beach, the typical warm beaches commercial.
Well, there is something very incorrect about this commercial. The commercial is geared for Valentines Day, which is in mid-February. As far as it can be known, February is winter in the Northern Hemisphere. And this is Myrtle Beach. The average February high temperature is 58 degrees F, and the average low is 40. This does not sound like beach weather. It would not be warm enough to play on the beach as if it were summer.
The commercial paints a very good picture of Myrtle Beach, but it isn't geographically correct. One cannot use summer scenes to market a place to people planning to go to that place in winter. That is misrepresentation. One important feature of tourism is geography. All the more reason to known one's geography.
Friday, January 24, 2014
Where to grow coffee in the USA?


The most valuable food commodity in the world is coffee. And the USA is a major consumer of coffee. Being a nation with a thirst for coffee, one might think "why not grow our own coffee"?
Well, let's break this down geographically.
To grow coffee, a warm climate, with little risk of frost is needed. Well, there are maybe a few places in the USA like that, specifically far southern Florida and parts of southern California. Hawaii is another place to consider.
For regions between 16 and 24 degrees latitude(both north and south), An altitude between 1800-3600 feet above sea level is right for growing coffee. This leaves out California and Florida. Southern California's temperatures aren't right for coffee planting at those altitudes, and California, even the southernmost point of it, is at too high of a latitude for that. Florida has no places at high latitudes. Also, a moderate amount of rainfall is necessary. Both Florida and California are either too dry or too wet for coffee. Only Hawaii's Kona region is suitable for growing coffee. Remember, all of this is for Arabica coffee beans. Robusta beans can be grown at lower altitudes, from sea level to 2000 ft above sea level. It grows in warmer temperatures
Could robusta coffee be grown in Florida? Well, even Florida gets a bit cool for growing such a plant. It could grown at low elevation areas in Hawaii.
Well, on a commercial level, growing coffee on the USA mainland does not appear likely, given the geography and climate of the mainland USA. Hawaii is the only place where commercial coffee growth is done, and for a reason. Puerto Rico grows coffee, but it is a Commonwealth of the USA, not a state.
Wednesday, January 22, 2014
Map of tea drinking per capita.

A map is like a picture, but in geographic form. It tells a thousand words. This map well, it tells many things, and reveals some surprises when one thinks about it.
According to this map, Turkey consumes the most tea per person per year. In a way, this does make sense. Tea is a major part of the Turkish culture, and has been this way for centuries. Tea is consumed for so many occasions. It is part of the hospitality of Turkey to offer tea to guests. It is consumed with meals, and it is part of social occasions. Tea is also grown in Turkey, so it makes sense to drink it.
The United Kingdom is the next largest consumer of tea on earth. Makes sense given the tradition of drinking tea in the UK, which goes back to the days of the British Empire. It is ingrained in the British culture.
Russia is next on the list. No surprise there. While Russia is widely known for the fiery vodka, tea is the most popular non-alcoholic drink in the nation. It has been part of the Russian culture for a long time.
However, there were also some surprises to this. One might think China and Japan would have more consumption of tea, considering the amount of tea grown in this region, and considering how ingrained tea drinking is in these culture. There are many varieties of tea in China, and tea drinking started in China. Japan has the elaborate tea ceremony and it is common to consume green tea with meals. Well, this is tea consumed per person. China has 1.8 billion people. And Japan does rank somewhat higher than China in tea consumption per capita, considering the much smaller population. One theory could be that while tea is consumed often, less of it is consumed.
One particular surprise was South America. One might think that the largest consumer of tea in South America would be Argentina, Uruguay, Brazil, or Paraguay, considering yerba mate is consumed in these nations. Chile has the largest consumption of tea per person per year in South America. There is no data available for Uruguay and Paraguay. With the gaucho culture being part of the culture in both Paraguay and Uruguay, perhaps tea consumption might be higher in those nations. Actually, in Uruguay, 22 lbs of yerba mate is consumed per capita. However, perhaps when tea is spoken of, yerba mate is not what people are thinking of.
A map can tell many things, it can also reveal surprises.
The Nicaragua Canal?
The government of Nicaragua is planning to have a canal built across the southern portion of the nation. To put this is cartographic terms.............
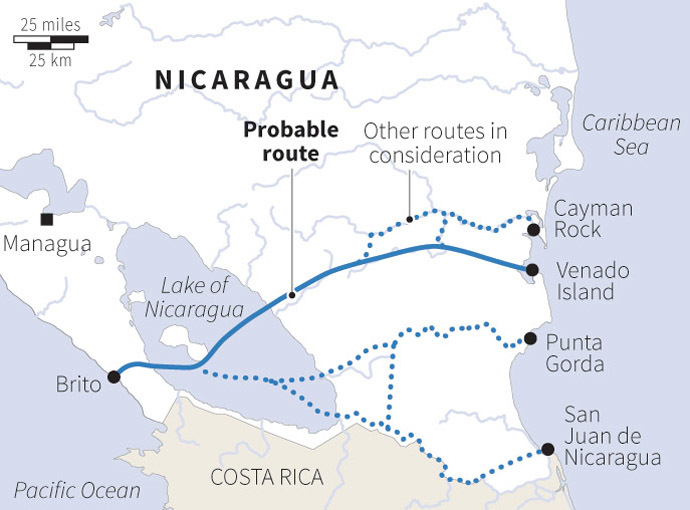
Photo from Reuters.
If one looks at this map, there is one main route being proposed. However, if you look at the dotted line, those are alternative routes being considered. One the Pacific side, it starts at Brito. The route will go through Lake Nicaragua. In geological terms, this would make sense, as this is the shortest route, the easiest route, and it connects to water. The main route cuts through rivers. One other route being considered also goes through rivers. The idea is that this canal will basically connect bodies of water, making it relatively easy to construct.
This canal is expected to rival the Panama Canal. The Panama Canal is considered a very great engineering feat. What is ironic is that if this canal in Nicaragua is completely by 2020 as expected, it will be over 3 times longer. The Panama Canal was only 77 kilometres long. It was chosen because of it was the narrowest point on the continent.
One question is this. Would building a canal across Nicaragua shorten maritime journeys in the same way the Panama Canal did? That is something very important to consider. Will it complement the Panama Canal? Or will journeys be a bit longer? Important questions to ask, considering the reason for building the Panama Canal.
Tuesday, January 21, 2014
America's healthiest cities: A geographic perspective.
Before the heart of this entry can be typed, one must read this link from TODAY: http://www.today.com/health/healthy-wealthy-wise-americas-fittest-city-2D11957442
The 20 healthiest cities in the USA:
The 20 healthiest cities in the USA:
- Minneapolis, St. Paul
- Washington, D.C.
- Boston
- San Francisco
- Hartford, Conn.
- Sacramento, Calif.
- Portland, Ore.
- Seattle
- Denver, Colo.
- Austin, Texas
- Virginia Beach, Va.
- San Jose, Calif.
- Salt Lake City
- Raleigh, N.C.
- Pittsburgh, Pa.
- San Diego, Calif.
- Richmond, Va.
- Providence, R.I.
- Baltimore. Md.
- Cincinnati, Ohio
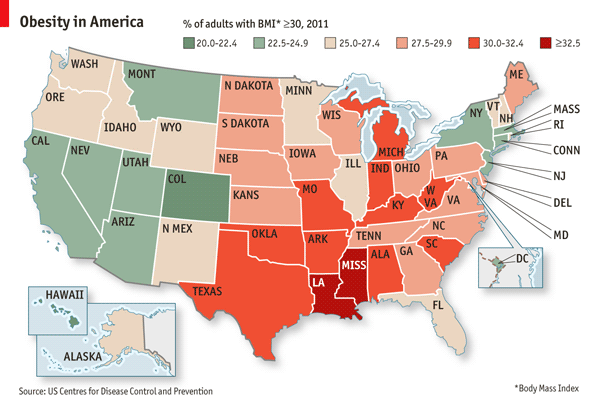
The healthiest, Minneapolis-St. Paul, located in one of the coldest states in the USA, stands out in a way. Though Seattle is the northernmost city on this list, Minneapolis-St. Paul area is the coldest among them. One might think the coldest places would be the unhealthiest. One might think "cabin fever". Well, there are more factors to consider. According to the article, urban planning is something to look at. Minneapolis has among the highest number of parks in the USA. It is one of the most bicycle-friendly cities in the USA, up there with Portland.Oregon(also among the top 20 healthiest cities in the nation). So in some ways, it makes sense that Twin Cities area is among the healthiest places in the USA.
Consider the map above. Minneapolis, the healthiest, is in Minnesota. As far as obesity rates are concerned, Minnesota and Illinois have the lowest obesity rates in the Midwestern USA. California has the most cities under the "healthiest category". Los Angeles is not among them though. However, California has a relatively low obesity rate than most places in the USA. California is known for having an outdoorsy lifestyle. And why not? Swimming in the Pacific Ocean, hiking, biking, skiing, and there are ample options for healthy foods. Considering that California grows a variety of fruits and vegetables, it makes perfect sense that the vegetarian lifestyle is quite welcomed and accepted there. States with low obesity rates such as Colorado, Utah, Massachusetts, and Connecticut have cities in the "healthiest" category, such as Denver, Boston, Hartford, and Salt Lake City. Colorado and Utah are known for having outdoorsy lifestyles, with ample hiking, skiing, and other outdoor activities. Washington DC also has a low obesity rate.
Pittsburgh, Austin, and Virginia Beach seem to be the biggest standouts. Austin especially. Pittsburgh has changed alot from its days in the steel mill industry, so the city has most likely cleaned up, and there is a healthier lifestyle that has come from this as well. However, Pennsylvania as a whole has a relatively high obesity rate. Austin stands out because Texas has among the highest obesity rates in the nation. Austin stands out within the state of Texas for many reasons. It is politically more liberal than other Texas cities, is widely known for being a college city (UTX-Austin anyone?), and is known for the "Keep Austin Weird" thing. Austin is known for being different from other Texas cities, a lifestyle different from other cities, and there are mostly likely more things to accommodate a healthier lifestyle. Virginia Beach, well, one could consider the high military population, which is required to be in better physical condition than those in the civilian population. Another factor is being near the ocean, which means many opportunities for swimming.
Of course, there is more to look at that just obesity. Look at heart disease, pollution, stress, and other indicators.
Sunday, January 19, 2014
Small video from Polar Vortex, 7 January 2014
This video footage, taking in Marietta,GA, shows how cold it got during the polar vortex on the week of 6 January 2014. This video was just put up, but the footage is from 7 January. Check this out. See how cold it was.
Saturday, January 18, 2014
Check out this video
This is a comic spoof about geography. Actually, this is a video about an absent-minded student and a frustrated geography teacher. It's suppose to be a humorous approach to the lack of geo-literacy.
Friday, January 17, 2014
Arctic Blast redux: The Polar Vortex
Earlier in January, the Arctic Blast dipped into the USA, sending temperatures into record levels. In the coming days, it is going to happen again. And there is a term for it: Polar Vortex.

Saturday, January 4, 2014
Arctic Blast.
In the coming days, temperatures in the USA are due for a major plunge. An arctic blast is coming in, from a northwestern direction, and it will send temperatures below zero in many places.


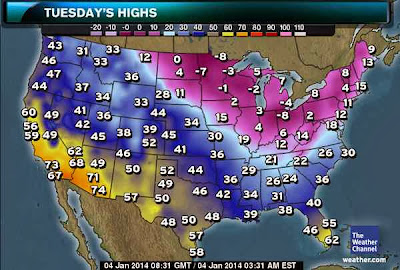


Weather maps with the high temperatures for January 5-7, 2014.
One major subject that has come up is global warming. Many are quick to point out "it's a crock". Well, if one is to consider geography, take a very good look at these maps. While a large part of the USA is being covered in very cold temperatures in the next few days, look very closely at where those temperatures are. On Tuesday, the city of Jacksonville, Florida, USA, is poised to have a high of 40 degrees Fahrenheit. In sunny Florida. Miami, which is quite close to Cuba, will have a high of 62 degrees Fahrenheit. Atlanta,Georgia,USA is poised to have a high of 24 degrees Fahrenheit, almost 30 degrees below normal for January.
However, look at the map for Tuesday. Now look at Denver, Colorado,USA. The Mile High City, located as Philadelphia and Indianapolis to the east, and on a far northern latitude than Atlanta, will have a high ABOVE freezing while Atlanta, Philadelphia, and Indianapolis will have highs below freezing. Colorado Springs will reach a high of 52 degrees Fahrenheit. New Orleans, on the Gulf of Mexico, will reach 39 degrees Fahrenheit. Now, it might be a good idea to consider that the Front Range region of Colorado does get the chinook winds, which descend down the leeward side of the Rocky Mountains, and temperatures can get warmer. However, what role does the chinook winds play. More importantly, look at the highs for Denver and Colorado Springs for Sunday and Monday. Atlanta and Jacksonville will be much warmer than Denver or Colorado Springs. This pattern begins to change on Monday. One must consider the Jet Stream and its placement. Yes, it will be cold on one part of the nation. However, notice the movement of temperatures. It becomes progressively colder in the eastern part of the USA. It begins warming up in the southwest and parts of the Rockies. How long will this last? And it;s the beginning of January, the first day of Spring isn't for over 2 months. Only time can tell.
Another consideration is that this is the USA. It might be very cold now, but how is it in other parts of the world considering the same latitudes? That is one thing to consider. One must consider that it is too early to tell, and that there is more to global warming than where you personally live. Look at the whole world.
Wednesday, January 1, 2014
When Geography and Astronomy Come Together.
A commune (French equivalent of an township) of around 29,000 residents along the coast of French Guiana. Basically, like a small town. There are many who do not even know what French Guiana is, much less, where this small town being spoken of is. However, it has a very strategic importance.
Kourou is the commune being spoken of. It is located along the northern coast of the French overseas department of French Guiana. What is the importance? Well, if one is into astronomy, listen closely.


Kourou is the commune being spoken of. It is located along the northern coast of the French overseas department of French Guiana. What is the importance? Well, if one is into astronomy, listen closely.

Map of French Guiana showing there Kourou is in relation to French Guiana's capital, Cayenne.
Map from BBC.
Kourou is where the Guiana Space Center is located. It is a major place for launching French and other European rockets. Why was Kourou chosen?
1) Kourou is located relatively close to the equator
2) The sea provides a large amount of space that is uninhabited.

In order to have a decent place to launch rockets, lots of uninhabited space is necessary, so that the refuse from rocket launches does not land in inhabited areas. In order to do that, rockets much be launched towards the east.
And being relatively close to the equator means that the spin of the earth will give some extra velocity for rockets being launched in the eastern direction.

Diagram explaining launching a Russian rocket from Kourou works. RIA-NOVOSTI
There is it. Geography has proven to be very important for astronomy.
Subscribe to:
Comments (Atom)